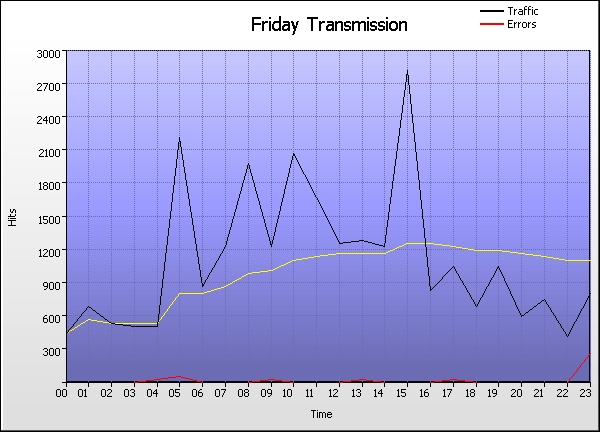
Time Graph
Go the Help Card.


Friday Transmission
  Time Hits % Bytes % Sessions Visitors Pages Errors
1 00:00 - 00:59
467    1.72%
0    0%
74,152 66,072 352 17
2 01:00 - 01:59
692    2.54%
0    0%
66,701 59,848 344 19
3 02:00 - 02:59
562    2.06%
0    0%
77,156 68,032 385 22
4 03:00 - 03:59
513    1.88%
0    0%
89,962 78,300 329 19
5 04:00 - 04:59
520    1.91%
0    0%
67,047 60,529 345 35
6 05:00 - 05:59
2,247    8.25%
0    0%
82,381 73,890 917 77
7 06:00 - 06:59
897    3.29%
0    0%
100,159 87,776 451 22
8 07:00 - 07:59
1,258    4.62%
0    0%
87,147 75,863 492 21
9 08:00 - 08:59
1,992    7.32%
0    0%
102,654 93,154 614 21
10 09:00 - 09:59
1,254    4.61%
0    0%
89,015 75,469 412 58
11 10:00 - 10:59
2,090    7.68%
0    0%
124,409 108,773 703 17
12 11:00 - 11:59
1,698    6.24%
0    0%
109,024 97,630 708 12
13 12:00 - 12:59
1,280    4.70%
0    0%
84,597 77,727 451 22
14 13:00 - 13:59
1,307    4.80%
0    0%
80,863 73,813 460 36
15 14:00 - 14:59
1,255    4.61%
0    0%
75,047 66,719 429 11
16 15:00 - 15:59
2,842    10.4%
0    0%
90,795 84,252 603 14
17 16:00 - 16:59
847    3.11%
0    0%
79,384 70,161 318 20
18 17:00 - 17:59
1,073    3.94%
0    0%
92,757 87,704 497 32
19 18:00 - 18:59
704    2.59%
0    0%
90,718 85,344 287 18
20 19:00 - 19:59
1,066    3.92%
0    0%
77,953 71,029 354 16
21 20:00 - 20:59
607    2.23%
0    0%
76,682 68,413 305 6
22 21:00 - 21:59
776    2.85%
0    0%
74,896 66,493 327 28
23 22:00 - 22:59
448    1.65%
0    0%
71,308 64,314 242 12
24 23:00 - 23:59
831    3.05%
0    0%
83,586 74,405 569 287
  Average
1,134    4.17%
0    0%
85,349 76,487 453 35
24 Totals
27,226    100%
0    0%
41,235 7,766 10,894 842
Go the Help Card.

Help Card: Friday Transmission
Report Overview This report details the hour-by-hour breakdown of traffic generated on all Fridays. Use this information to assess the damage of unforeseen downtime, or to find key traffic spikes that could be used to influence special features or promotions.

This report may be affected by world time zones. Many webservers generate timestamps in Greenwich Mean Time (GMT+0), which may not be your local time zone. The time data in your logs can be adjusted to represent your local time zone, in Settings > Analysis > Options > Date range > Time adjust.

Graph Description Vertical axis: Hits (default sorting).
Number of hits to the site. Changing the sorting options in Settings > Statistics will alter the vertical axis to the new sort method (Visitors, Bytes, etc). This report may be sorted by hits, bytes, sessions, visitors, pages or errors.

Horizontal axis: Time
The hour of the day.

Red line (if present):
HTTP errors (Page not found, server error, etc)

Table Description Time:
The hourly period of the corresponding day.

Hits (%):
Number of hits to the site during the corresponding hourly period. (Percentage as a proportion of hits to the site during the day's 24 hours.)

Bytes (%):
Number of bytes transferred as a result of hits to the site during the corresponding hourly period. For readability, these values may be suffixed with kilobytes (KB), megabytes (MB) or gigabytes (GB), where applicable. (Percentage as a proportion of bytes transferred during the day's 24 hours.)

Sessions:
Total number of sessions undertaken during the corresponding hourly period. This number includes sessions undertaken by 'repeat' visitors.

Visitors:
Total number of unique visitors who undertook one or more sessions during the corresponding hourly period. Note that this figure represents a unique hourly visitor count, not a unique daily visitor count (as a unique visitor for one hour may return in another hour). As such, the "Totals" value will be cumulative for the 24 hours and the overall totals for individual days may appear higher than expected.

Pages
Number of pages viewed during the corresponding hourly period.

Errors
Number of server errors generated as a result of hits to the site during the corresponding hourly period.

Go back to the top.

Copyright © Quest Software , 1997-2002