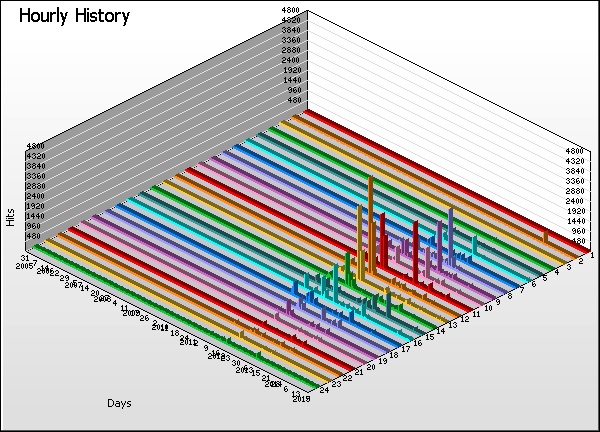
Time Graph
Go the Help Card.


Hourly History
  Time Hits % Bytes % Sessions Visitors Pages Errors
1 00:00 - 00:59
2,854    1.27%
0    0%
514,646 468,687 1,804 106
2 01:00 - 01:59
3,771    1.68%
0    0%
473,717 429,075 2,377 117
3 02:00 - 02:59
2,879    1.28%
0    0%
498,946 443,956 1,885 141
4 03:00 - 03:59
2,997    1.34%
0    0%
481,019 433,423 1,762 208
5 04:00 - 04:59
3,646    1.63%
0    0%
487,941 439,937 1,866 163
6 05:00 - 05:59
5,605    2.50%
0    0%
543,066 490,918 2,834 419
7 06:00 - 06:59
6,802    3.03%
0    0%
573,366 513,231 2,878 552
8 07:00 - 07:59
12,494    5.57%
0    0%
592,537 526,707 3,729 213
9 08:00 - 08:59
15,130    6.75%
0    0%
700,788 634,321 5,197 1,135
10 09:00 - 09:59
12,995    5.80%
0    0%
680,327 626,153 3,963 509
11 10:00 - 10:59
18,216    8.13%
0    0%
730,540 663,035 5,024 434
12 11:00 - 11:59
18,820    8.40%
0    0%
812,710 744,239 4,997 663
13 12:00 - 12:59
15,620    6.97%
0    0%
685,447 637,076 4,201 540
14 13:00 - 13:59
15,375    6.86%
0    0%
670,657 599,224 4,116 653
15 14:00 - 14:59
14,569    6.50%
0    0%
647,796 590,073 4,248 329
16 15:00 - 15:59
14,200    6.34%
0    0%
642,520 596,483 3,951 587
17 16:00 - 16:59
10,806    4.82%
0    0%
583,735 530,809 3,574 607
18 17:00 - 17:59
8,928    3.98%
0    0%
593,355 549,007 2,741 250
19 18:00 - 18:59
6,937    3.09%
0    0%
592,189 545,480 2,477 187
20 19:00 - 19:59
8,030    3.58%
0    0%
566,283 522,979 2,921 233
21 20:00 - 20:59
6,397    2.85%
0    0%
545,732 501,640 2,530 151
22 21:00 - 21:59
6,020    2.69%
0    0%
521,970 476,216 2,396 219
23 22:00 - 22:59
5,884    2.63%
0    0%
550,266 502,627 2,449 260
24 23:00 - 23:59
5,167    2.31%
0    0%
510,203 465,594 2,514 491
  Average
9,339    4.17%
0    0%
591,656 538,787 3,184 381
24 Totals
224,142    100%
0    0%
41,235 7,766 76,434 9,167
Go the Help Card.

Help Card: Hourly History
Report Overview This report highlights trends in the hour-by-hour usage of your web site over time. Use this information to assess whether there are noticeable periods of intense or calm traffic, which can influence future downtime considerations and/or special promotions.

This report may be affected by world time zones. Many webservers generate timestamps in Greenwich Mean Time (GMT+0), which may not be your local time zone. The time data in your logs can be adjusted to represent your local time zone, in Settings > Analysis > Options > Date range > Time adjust.

Graph Description Vertical axis: Hits (default sorting).
Changing the sorting options in Settings > Statistics will alter the vertical axis to the new sort method.

Horizontal axis: Days.
All days of the report period.

Depth (Z) axis: Hours.
The numbers along this axis correspond to the numbered entries in the table.

Table Description Time:
The hourly period as the focus of this report.

Hits (%):
Number of hits to the site during the corresponding hourly period. (Percentage as a proportion of hits to the site during the day's 24 hours.)

Bytes (%):
Number of bytes transferred as a result of hits to the site during the corresponding hourly period. For readability, these values may be suffixed with kilobytes (KB), megabytes (MB) or gigabytes (GB), where applicable. (Percentage as a proportion of bytes transferred during the day's 24 hours.)

Sessions:
Total number of sessions undertaken during the corresponding hourly period. This number includes sessions undertaken by 'repeat' visitors. Note that he total of this column represents an overall session count for the entire period including those sessions overlapping hourly time periods. For this reason, the total of this column may appear smaller than the figure when adding up each row individually.

Visitors:
Total number of unique visitors who participated in sessions during the corresponding hourly period. Note that this figure represents a unique hourly visitor count, not a unique daily visitor count (as a unique visitor for one hour may return in another hour). As such, the "Totals" value will be cumulative for the 24 hours and the overall total for individual rows may be more than in the Totals row..

Pages:
Number of pages viewed during the corresponding hourly period.

Errors:
Number of server errors generated as a result of hits to the site during the corresponding hourly period.
Go back to the top.

Copyright © Quest Software , 1997-2002