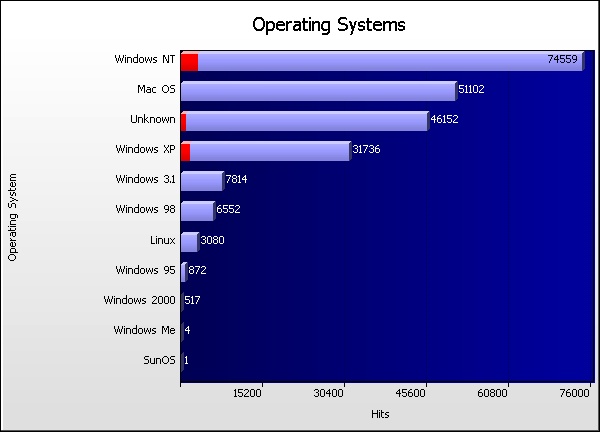
Operating System Graph
Go the Help Card.


Operating Systems
  Operating System Hits % Bytes % Visitors Pages Errors
1 Windows NT
74,559    33.5%
0    0%
2,552 16,769 3,168
2 Mac OS
51,102    23.0%
0    0%
3,656 13,317 205
3 Unknown
46,152    20.8%
0    0%
6,050 32,938 1,513
4 Windows XP
31,736    14.3%
0    0%
1,516 7,384 1,826
5 Windows 3.1
7,814    3.51%
0    0%
288 1,271 355
6 Windows 98
6,552    2.95%
0    0%
463 1,778 708
7 Linux
3,080    1.38%
0    0%
254 1,155 110
8 Windows 95
872    <1%
0    0%
39 149 12
9 Windows 2000
517    <1%
0    0%
85 213 33
10 Windows Me
4    <1%
0    0%
2 4 2
11 SunOS
1    <1%
0    0%
1 0 0
  Average
20,217    9.09%
0    0%
1,355 6,816 721
11 Totals
222,389    100%
0    0%
14,906 74,978 7,932
Go the Help Card.

Help Card: Operating Systems
Report Overview This report shows the operating systems (and version number, where applicable) being used by site visitors to make hits to your site. Use this information to ensure that your site content is viewable by visitors on all operating systems. Additionally, different operating systems tend to represent different types of visitors, which should be taken into consideration when planning future site content.

Graph Description Vertical axis: Operating System.
Name of the operating system being analyzed.

Horizontal axis: Hits (default sorting).
Hits that were made by a visitor using the corresponding operating system. Changing the sorting options in Settings > Statistics will alter the horizontal axis to the new sort method. This report can be sorted/graphed by hits, bytes, visitors, pages or errors.

Red lines (if present):
HTTP errors (Page not found, server error, etc)

Table Description Operating System:
Name of the operating system being analyzed, along with its version number where applicable.

Hits (%):
Number of hits to the site by visitors using the corresponding operating system. (Percentage as a proportion of hits from all operating systems.)

Bytes (%):
Raw bytes transferred as a result of hits to the site by visitors using the corresponding operating system. (Percentage as a proportion of bytes transferred from all operating systems.)

Visitors:
Number of site visitors who used the corresponding operating system. This figure includes repeat visitors, so the total amount may appear higher than expected.

Pages:
Number of pages viewed using the corresponding operating system.

Errors:
Number of server errors generated as a result of hits to the site by visitors using the corresponding operating system.
Go back to the top.

Copyright © Quest Software , 1997-2002