|
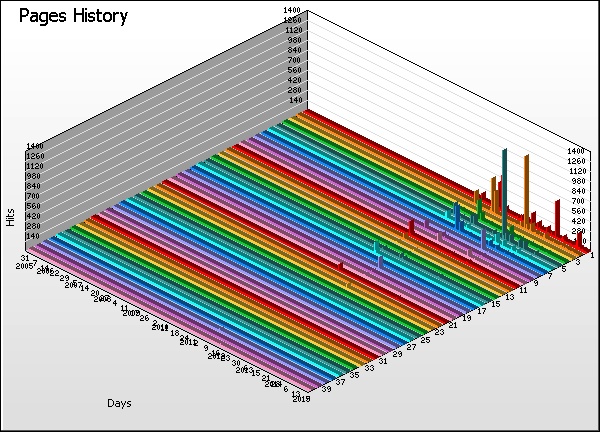
Pages History |
| |
Pages |
Hits |
% |
Bytes |
% |
Sessions |
Mean Time |
Visitors |
Errors |
|
1 |
/index.php |
|
|
13,374 |
00:24 |
4,571 |
35 |
|
2 |
/details-event.php |
|
|
5,371 |
01:15 |
2,333 |
45 |
|
3 |
/robots.txt |
|
|
7,725 |
00:48 |
1,646 |
160 |
|
4 |
/sites/zoom.php |
|
|
3,904 |
00:56 |
1,513 |
0 |
|
5 |
/results-frame.php |
|
|
722 |
03:49 |
548 |
28 |
|
6 |
/map.php |
|
|
2,373 |
01:03 |
1,533 |
0 |
|
7 |
/main.html |
|
|
2,803 |
00:37 |
2,073 |
0 |
|
8 |
/slider.php |
|
|
1,539 |
01:01 |
666 |
0 |
|
9 |
/current.php |
|
|
1,101 |
00:59 |
712 |
47 |
|
10 |
/blank.html |
|
|
1,350 |
00:42 |
1,048 |
0 |
|
11 |
/admin/events-show.php |
|
|
885 |
01:18 |
98 |
882 |
|
12 |
/past.php |
|
|
831 |
00:42 |
561 |
37 |
|
13 |
/modern.php |
|
|
824 |
00:34 |
547 |
12 |
|
14 |
/program.html |
|
|
802 |
00:34 |
568 |
13 |
|
15 |
/currentmap.php |
|
|
469 |
01:08 |
402 |
0 |
|
16 |
/admin/events-form.php |
|
|
150 |
04:16 |
32 |
148 |
|
17 |
/contacts.html |
|
|
576 |
00:28 |
359 |
7 |
|
18 |
/sites/25_img/zoomifyViewer.swf |
|
|
510 |
00:44 |
393 |
0 |
|
19 |
/pastmap.php |
|
|
301 |
00:57 |
253 |
0 |
|
20 |
/modernmap.php |
|
|
277 |
00:55 |
245 |
1 |
|
21 |
/admin/events-handle.php |
|
|
74 |
02:03 |
12 |
50 |
|
22 |
/download.php |
|
|
132 |
01:50 |
118 |
0 |
|
23 |
/sites/27_img/zoomifyViewer.swf |
|
|
243 |
00:45 |
151 |
0 |
|
24 |
/sites/24_img/zoomifyViewer.swf |
|
|
213 |
00:51 |
140 |
4 |
|
25 |
/sites/19_img/zoomifyViewer.swf |
|
|
196 |
00:53 |
110 |
2 |
|
26 |
/sites/18_img/zoomifyViewer.swf |
|
|
187 |
00:41 |
111 |
0 |
|
27 |
/sites/28_img/zoomifyViewer.swf |
|
|
199 |
00:33 |
105 |
0 |
|
28 |
/sites/21_img/zoomifyViewer.swf |
|
|
196 |
00:47 |
129 |
4 |
|
29 |
/sites/23_img/zoomifyViewer.swf |
|
|
185 |
00:46 |
113 |
1 |
|
30 |
/sites/1_img/zoomifyViewer.swf |
|
|
181 |
00:54 |
99 |
0 |
|
31 |
/sites/22_img/zoomifyViewer.swf |
|
|
184 |
00:48 |
106 |
0 |
|
32 |
/sites/29_img/zoomifyViewer.swf |
|
|
172 |
00:37 |
78 |
1 |
|
33 |
/sites/20_img/zoomifyViewer.swf |
|
|
166 |
00:34 |
91 |
4 |
|
34 |
/sites/26_img/zoomifyViewer.swf |
|
|
148 |
00:46 |
72 |
0 |
|
35 |
/sites/30_img/zoomifyViewer.swf |
|
|
143 |
00:30 |
53 |
0 |
|
36 |
/sites/ |
|
|
33 |
01:44 |
26 |
130 |
|
37 |
/administrator/index.php |
|
|
81 |
00:37 |
76 |
129 |
|
38 |
/ |
|
|
55 |
01:01 |
25 |
3 |
|
39 |
/wp-login.php |
|
|
106 |
00:27 |
88 |
109 |
|
40 |
/components/com_hotornot2/phpthumb/phpThumb.php |
|
|
26 |
01:30 |
20 |
78 |
| |
Subtotals |
|
|
48,807 |
56:26 |
21,824 |
1,930 |
|
1,236 |
Others |
|
|
3,823 |
39:11:49 |
3,260 |
3,986 |
| |
Average |
|
|
41 |
00:48 |
19 |
4 |
|
1,276 |
Totals |
|
|
52,630 |
712:08:15 |
25,084 |
5,916 |
|
|


