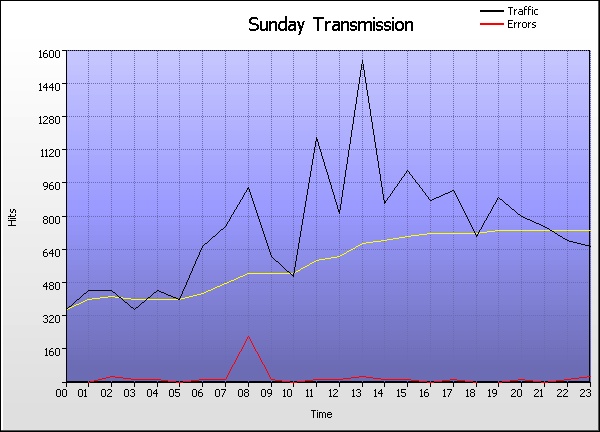
Time Graph
Go the Help Card.


Sunday Transmission
  Time Hits % Bytes % Sessions Visitors Pages Errors
1 00:00 - 00:59
364    2.04%
0    0%
73,314 68,664 205 7
2 01:00 - 01:59
462    2.59%
0    0%
74,616 68,819 254 9
3 02:00 - 02:59
452    2.53%
0    0%
70,637 60,278 357 42
4 03:00 - 03:59
365    2.04%
0    0%
62,605 56,582 226 27
5 04:00 - 04:59
459    2.57%
0    0%
54,732 51,854 192 18
6 05:00 - 05:59
406    2.27%
0    0%
78,286 68,601 277 6
7 06:00 - 06:59
658    3.68%
0    0%
78,134 68,211 285 27
8 07:00 - 07:59
766    4.29%
0    0%
81,975 71,183 328 16
9 08:00 - 08:59
957    5.36%
0    0%
83,917 75,969 621 227
10 09:00 - 09:59
621    3.48%
0    0%
73,538 69,373 299 22
11 10:00 - 10:59
526    2.95%
0    0%
65,608 58,799 202 5
12 11:00 - 11:59
1,186    6.64%
0    0%
76,884 67,664 399 20
13 12:00 - 12:59
829    4.64%
0    0%
77,043 73,151 329 21
14 13:00 - 13:59
1,567    8.77%
0    0%
88,175 74,878 402 45
15 14:00 - 14:59
870    4.87%
0    0%
80,383 75,442 319 18
16 15:00 - 15:59
1,028    5.76%
0    0%
85,638 76,119 344 17
17 16:00 - 16:59
880    4.93%
0    0%
77,092 73,521 299 15
18 17:00 - 17:59
935    5.24%
0    0%
72,862 66,981 309 16
19 18:00 - 18:59
710    3.98%
0    0%
68,670 61,394 293 9
20 19:00 - 19:59
896    5.02%
0    0%
78,462 69,952 338 10
21 20:00 - 20:59
815    4.56%
0    0%
79,858 69,189 326 21
22 21:00 - 21:59
753    4.22%
0    0%
69,084 58,853 313 13
23 22:00 - 22:59
693    3.88%
0    0%
72,830 66,193 350 17
24 23:00 - 23:59
662    3.71%
0    0%
66,385 62,039 263 46
  Average
744    4.17%
0    0%
74,613 67,237 313 28
24 Totals
17,860    100%
0    0%
41,235 7,766 7,530 674
Go the Help Card.

Help Card: Sunday Transmission
Report Overview This report details the hour-by-hour breakdown of traffic generated on all Sundays. Use this information to assess the damage of unforeseen downtime, or to find key traffic spikes that could be used to influence special features or promotions.

This report may be affected by world time zones. Many webservers generate timestamps in Greenwich Mean Time (GMT+0), which may not be your local time zone. The time data in your logs can be adjusted to represent your local time zone, in Settings > Analysis > Options > Date range > Time adjust.

Graph Description Vertical axis: Hits (default sorting).
Number of hits to the site. Changing the sorting options in Settings > Statistics will alter the vertical axis to the new sort method (Visitors, Bytes, etc). This report may be sorted by hits, bytes, sessions, visitors, pages or errors.

Horizontal axis: Time
The hour of the day.

Red line (if present):
HTTP errors (Page not found, server error, etc)

Table Description Time:
The hourly period of the corresponding day.

Hits (%):
Number of hits to the site during the corresponding hourly period. (Percentage as a proportion of hits to the site during the day's 24 hours.)

Bytes (%):
Number of bytes transferred as a result of hits to the site during the corresponding hourly period. For readability, these values may be suffixed with kilobytes (KB), megabytes (MB) or gigabytes (GB), where applicable. (Percentage as a proportion of bytes transferred during the day's 24 hours.)

Sessions:
Total number of sessions undertaken during the corresponding hourly period. This number includes sessions undertaken by 'repeat' visitors.

Visitors:
Total number of unique visitors who undertook one or more sessions during the corresponding hourly period. Note that this figure represents a unique hourly visitor count, not a unique daily visitor count (as a unique visitor for one hour may return in another hour). As such, the "Totals" value will be cumulative for the 24 hours and the overall totals for individual days may appear higher than expected.

Pages
Number of pages viewed during the corresponding hourly period.

Errors
Number of server errors generated as a result of hits to the site during the corresponding hourly period.

Go back to the top.

Copyright © Quest Software , 1997-2002