|
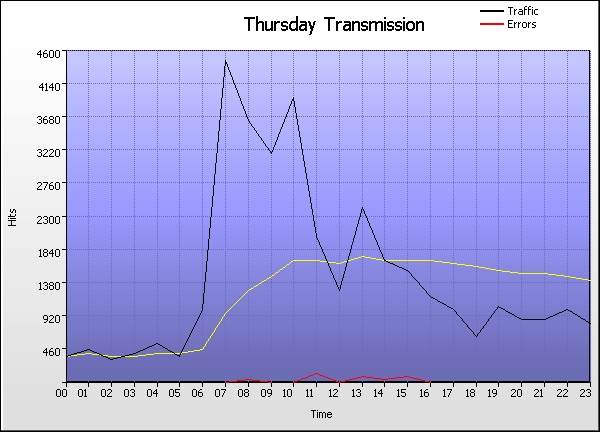
Thursday Transmission |
| |
Time |
Hits |
% |
Bytes |
% |
Sessions |
Visitors |
Pages |
Errors |
|
1 |
00:00 - 00:59 |
|
|
71,183 |
66,611 |
214 |
13 |
|
2 |
01:00 - 01:59 |
|
|
68,762 |
60,628 |
292 |
28 |
|
3 |
02:00 - 02:59 |
|
|
68,388 |
59,877 |
228 |
12 |
|
4 |
03:00 - 03:59 |
|
|
73,455 |
66,077 |
226 |
10 |
|
5 |
04:00 - 04:59 |
|
|
67,611 |
60,247 |
299 |
13 |
|
6 |
05:00 - 05:59 |
|
|
82,628 |
75,702 |
238 |
12 |
|
7 |
06:00 - 06:59 |
|
|
77,770 |
68,178 |
326 |
9 |
|
8 |
07:00 - 07:59 |
|
|
87,903 |
79,052 |
1,146 |
20 |
|
9 |
08:00 - 08:59 |
|
|
106,013 |
100,128 |
1,083 |
55 |
|
10 |
09:00 - 09:59 |
|
|
98,223 |
88,824 |
881 |
20 |
|
11 |
10:00 - 10:59 |
|
|
88,031 |
77,369 |
1,335 |
41 |
|
12 |
11:00 - 11:59 |
|
|
92,550 |
84,560 |
750 |
181 |
|
13 |
12:00 - 12:59 |
|
|
93,169 |
85,780 |
484 |
30 |
|
14 |
13:00 - 13:59 |
|
|
104,573 |
91,577 |
703 |
105 |
|
15 |
14:00 - 14:59 |
|
|
82,718 |
72,915 |
633 |
72 |
|
16 |
15:00 - 15:59 |
|
|
89,183 |
84,060 |
610 |
105 |
|
17 |
16:00 - 16:59 |
|
|
78,425 |
70,367 |
469 |
21 |
|
18 |
17:00 - 17:59 |
|
|
71,943 |
63,590 |
361 |
28 |
|
19 |
18:00 - 18:59 |
|
|
80,498 |
75,360 |
284 |
10 |
|
20 |
19:00 - 19:59 |
|
|
84,533 |
79,403 |
659 |
9 |
|
21 |
20:00 - 20:59 |
|
|
81,763 |
77,388 |
518 |
11 |
|
22 |
21:00 - 21:59 |
|
|
67,367 |
63,234 |
426 |
44 |
|
23 |
22:00 - 22:59 |
|
|
80,784 |
72,052 |
427 |
20 |
|
24 |
23:00 - 23:59 |
|
|
83,113 |
72,878 |
470 |
17 |
| |
Average |
|
|
82,524 |
74,827 |
544 |
36 |
|
24 |
Totals |
|
|
41,235 |
7,766 |
13,062 |
886 |
|
|