|
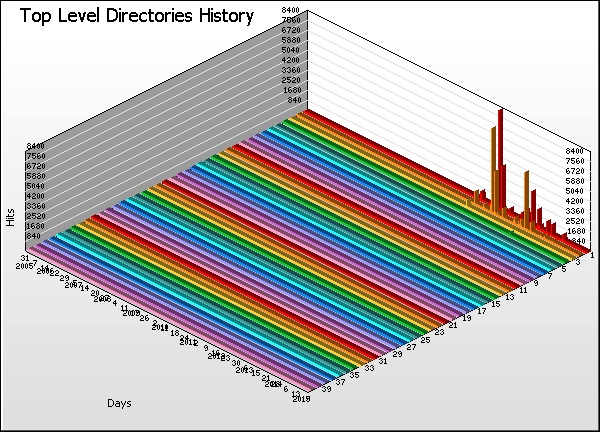
Top Level Directories History |
| |
Directory |
Hits |
% |
Bytes |
% |
Pages |
Errors |
|
1 |
/Images/ |
|
|
3 |
10 |
|
2 |
/sites/ |
|
|
10,125 |
2,162 |
|
3 |
/admin/ |
|
|
2,740 |
1,494 |
|
4 |
/include/ |
|
|
67 |
100 |
|
5 |
/webreport/ |
|
|
308 |
0 |
|
6 |
/wp-content/ |
|
|
319 |
319 |
|
7 |
/components/ |
|
|
171 |
173 |
|
8 |
/administrator/ |
|
|
167 |
167 |
|
9 |
/modules/ |
|
|
74 |
74 |
|
10 |
/lib/ |
|
|
71 |
71 |
|
11 |
/fckeditor/ |
|
|
60 |
64 |
|
12 |
/phpmyadmin/ |
|
|
59 |
59 |
|
13 |
/js/ |
|
|
53 |
53 |
|
14 |
/editor/ |
|
|
36 |
36 |
|
15 |
/cms/ |
|
|
33 |
35 |
|
16 |
/libs/ |
|
|
30 |
30 |
|
17 |
/gallery/ |
|
|
30 |
30 |
|
18 |
/web/ |
|
|
28 |
28 |
|
19 |
/manager/ |
|
|
27 |
27 |
|
20 |
/common/ |
|
|
26 |
26 |
|
21 |
/zadmin/ |
|
|
26 |
26 |
|
22 |
/assets/ |
|
|
26 |
26 |
|
23 |
/class/ |
|
|
26 |
26 |
|
24 |
/content/ |
|
|
26 |
26 |
|
25 |
/staticfiles/ |
|
|
26 |
26 |
|
26 |
/global/ |
|
|
26 |
26 |
|
27 |
/thumb/ |
|
|
26 |
26 |
|
28 |
/mambots/ |
|
|
26 |
26 |
|
29 |
/phpThumb/ |
|
|
26 |
26 |
|
30 |
/joomla/ |
|
|
24 |
25 |
|
31 |
/php-my-admin/ |
|
|
25 |
25 |
|
32 |
/includes/ |
|
|
23 |
23 |
|
33 |
/pma/ |
|
|
23 |
23 |
|
34 |
/uploads/ |
|
|
0 |
19 |
|
35 |
/Blog/ |
|
|
18 |
18 |
|
36 |
/mysqladmin/ |
|
|
18 |
18 |
|
37 |
/myadmin/ |
|
|
17 |
17 |
|
38 |
/phpadmin/ |
|
|
17 |
17 |
|
39 |
/phpmyadmin2/ |
|
|
16 |
16 |
|
40 |
/phpmyadmin1/ |
|
|
16 |
16 |
| |
Subtotals |
|
|
14,858 |
5,409 |
|
462 |
Others |
|
|
1,477 |
1,488 |
| |
Average |
|
|
32 |
13 |
|
502 |
Totals |
|
|
16,335 |
6,897 |
|
|