|
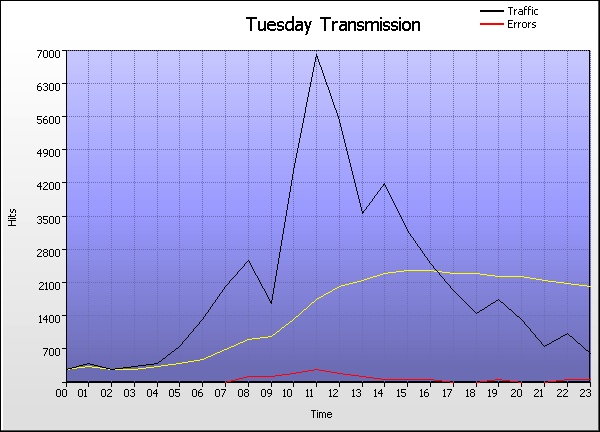
Tuesday Transmission |
| |
Time |
Hits |
% |
Bytes |
% |
Sessions |
Visitors |
Pages |
Errors |
|
1 |
00:00 - 00:59 |
|
|
71,742 |
65,536 |
211 |
12 |
|
2 |
01:00 - 01:59 |
|
|
70,309 |
63,393 |
219 |
8 |
|
3 |
02:00 - 02:59 |
|
|
70,603 |
64,983 |
196 |
6 |
|
4 |
03:00 - 03:59 |
|
|
72,711 |
64,950 |
174 |
6 |
|
5 |
04:00 - 04:59 |
|
|
69,127 |
61,120 |
251 |
49 |
|
6 |
05:00 - 05:59 |
|
|
70,086 |
62,108 |
264 |
11 |
|
7 |
06:00 - 06:59 |
|
|
90,023 |
81,399 |
452 |
48 |
|
8 |
07:00 - 07:59 |
|
|
80,938 |
70,967 |
623 |
51 |
|
9 |
08:00 - 08:59 |
|
|
112,935 |
103,511 |
816 |
155 |
|
10 |
09:00 - 09:59 |
|
|
110,098 |
102,688 |
590 |
154 |
|
11 |
10:00 - 10:59 |
|
|
152,238 |
139,283 |
913 |
214 |
|
12 |
11:00 - 11:59 |
|
|
176,696 |
160,784 |
1,284 |
307 |
|
13 |
12:00 - 12:59 |
|
|
152,664 |
140,102 |
1,047 |
220 |
|
14 |
13:00 - 13:59 |
|
|
117,220 |
109,514 |
784 |
154 |
|
15 |
14:00 - 14:59 |
|
|
110,440 |
101,474 |
1,006 |
96 |
|
16 |
15:00 - 15:59 |
|
|
104,134 |
99,473 |
654 |
113 |
|
17 |
16:00 - 16:59 |
|
|
99,173 |
90,046 |
666 |
128 |
|
18 |
17:00 - 17:59 |
|
|
96,910 |
88,915 |
428 |
57 |
|
19 |
18:00 - 18:59 |
|
|
98,572 |
93,610 |
446 |
33 |
|
20 |
19:00 - 19:59 |
|
|
84,425 |
79,533 |
455 |
71 |
|
21 |
20:00 - 20:59 |
|
|
83,773 |
76,094 |
369 |
19 |
|
22 |
21:00 - 21:59 |
|
|
78,253 |
72,028 |
275 |
11 |
|
23 |
22:00 - 22:59 |
|
|
77,843 |
74,155 |
368 |
84 |
|
24 |
23:00 - 23:59 |
|
|
69,314 |
64,580 |
402 |
115 |
| |
Average |
|
|
96,676 |
88,760 |
537 |
88 |
|
24 |
Totals |
|
|
41,235 |
7,766 |
12,893 |
2,122 |
|
|